Why Unemployment Drops But You Still Feel It
About this video
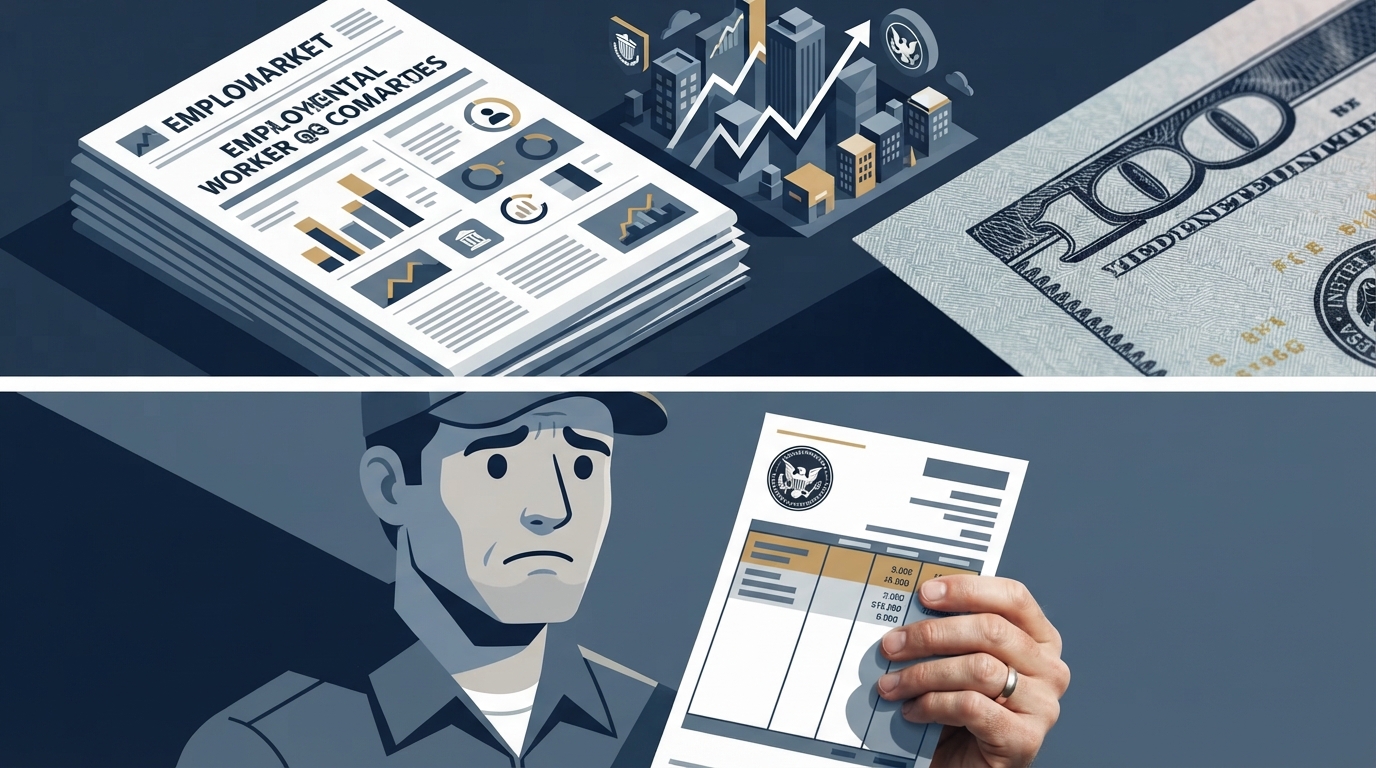
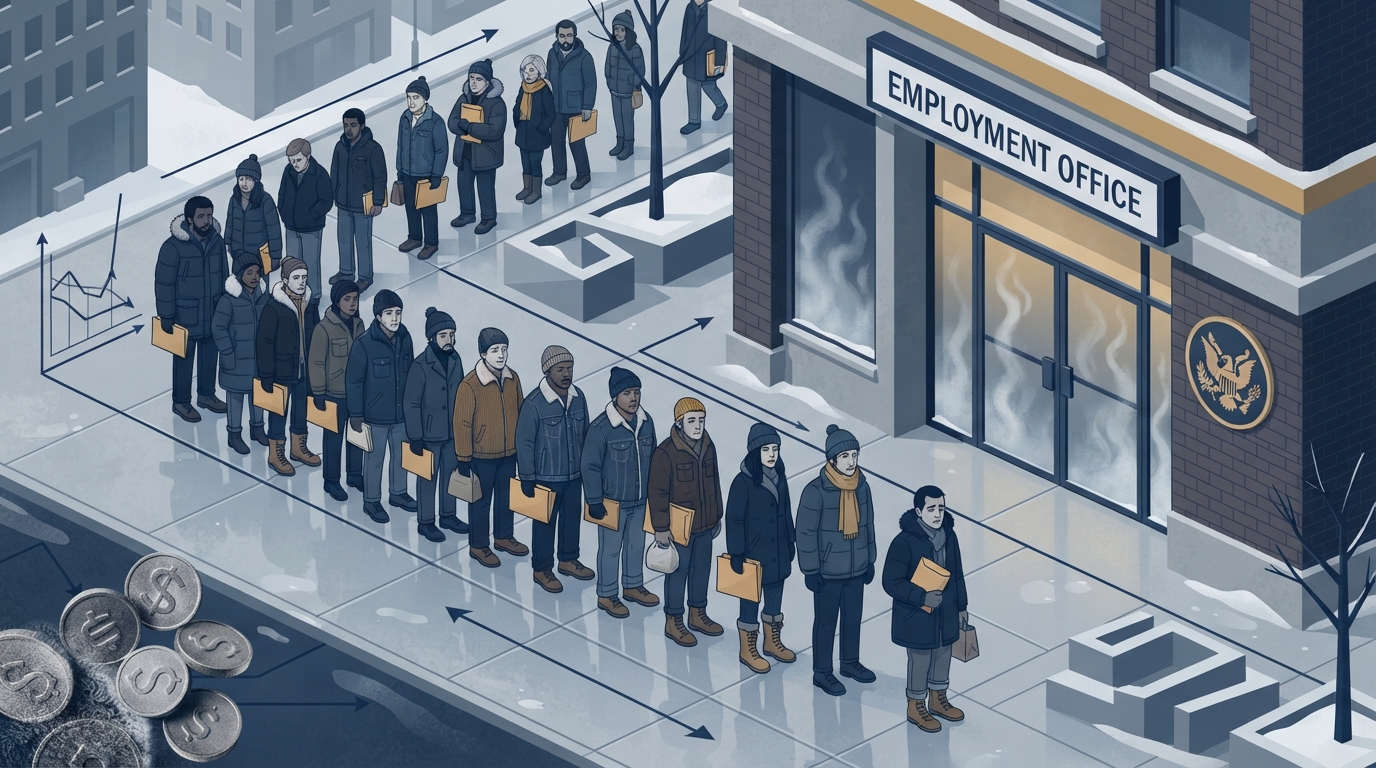
Why can unemployment fall while many people still feel left out? This video explains the difference between the U-3 and U-6 unemployment rates, labor force participation, and underemployment, and why a strong jobs report can miss regional and industry pain. Chapters: 00:00 The Headline vs. The Reality 00:15 The invisible jobless 00:27 The gap explains the pain 00:43 U-3 Definition 00:57 Invisible Jobless 01:12 The Broader Measure 01:27 Underemployment Counted 01:43 The Grim Reality 01:58 How wide does the gap get? 02:12 The 83% gap pattern 02:28 Which rate counts? 02:44 Participation Rate 2024 03:00 D.C. vs. West Virginia 03:16 The National Number Hides Local Truth 03:32 A Nation Divided by Geography 03:48 National Numbers Miss Local Reality 04:04 Job Gains vs. Wage Growth 04:20 The Real Takeaway 04:36 The Hidden Unemployed 04:52 The Participation Puzzle 05:08 Strong Report, Weak Paychecks 05:24 Participation Rate Decline 05:40 U-6 Still Elevated 05:56 The Underemployed 06:12 The Hidden Unemployment Sources & further reading: • U-3 vs. U-6: Understanding Unemployment Rate Differences — https://www.investopedia.com/articles/investing/080415/true-unemployment-rate-u6-vs-u3.asp • U-3 vs. U-6 Rates: Unemployment & Underemployment — https://www.britannica.com/money/u3-unemployment-vs-u6-underemployment • The Six Definitions of Unemployment. What Matters Most? — https://www.cmegroup.com/openmarkets/economics/2025/The-Six-Definitions-of-Unemployment-What-Matters-Most.html • Alternative Measures of Labor Underutilization for States — https://www.bls.gov/lau/stalt.htm • Regional and State Unemployment - 2024 Annual Averages — https://www.bls.gov/news.release/pdf/srgune.pdf • The March Jobs Report and the Story of Time — https://cepr.net/publications/the-march-jobs-report-and-the-story-of-time
From the video









More from Macro Plainly

Japan Bought 5 Trillion Yen of Foreign Assets in Two Weeks: Why Now?
Why Mass Layoffs Boost Stock Prices Instantly

Rent as a Recession Warning

The 2020 Negative Oil Freakout

Insurance Exits Erase Home Value

The $250 Tariff Mystery: Why Retail Prices Don't Jump

Why China's Factories Beat Vietnam's: The Ecosystem Advantage